Microglia
Microglia-Derived Interleukin-6 Triggers Astrocyte Apoptosis in the Hippocampus and Mediates Depression-Like Behavior
Shi-Yu Shen et al. Adv Sci (Weinh). 2025 Mar.
Abstract
In patients with major depressive disorder (MDD) and animal models of depression, key pathological hallmarks include activation of microglia as well as atrophy and loss of astrocytes. Under certain pathological conditions, microglia can inflict damage to neurons and astrocytes. However, the precise mechanisms underlying how activated microglia induced astrocyte atrophy and loss remain enigmatic. In this study, a depression model induced by chronic social defeat stress (CSDS) is utilized. The results show that CSDS induces significant anxiety- and depression-like behaviors, along with notable astrocyte atrophy and apoptosis, microglial activation, and elevated levels of microglial interleukin-6 (IL-6). Subsequent studies demonstrate that IL-6 released from activated microglia promotes astrocyte apoptosis. Furthermore, the knockdown of the P2X7 receptor (P2X7R) in microglia, which is implicated in the stress response, reduces stress-induced microglial activation, IL-6 release, and astrocyte apoptosis. Direct inhibition of microglia by minocycline corroborates these effects. The selective knockdown of IL-6 in microglia and IL-6 receptors in astrocytes effectively mitigates depression-like behaviors and reduces astrocyte atrophy. This study identifies microglial IL-6 as a key factor that contributes to astrocyte apoptosis and depressive symptoms. Consequently, the IL-6/IL-6R pathway has emerged as a promising target for the treatment of depression.
Keywords: IL‐6; apoptosis; astrocytes; depression; microglia.
© 2025 The Author(s). Advanced Science published by Wiley‐VCH GmbH.
PubMed Disclaimer
Conflict of interest statement
The authors declare no conflict of interest.
Figures
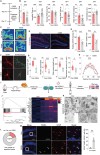 Figure 1
 CSDS causes anxiety‐and depression‐ like behaviors as well as hippocampal astrocyte atrophy and apoptosis. A) Experimental timeline of CSDS protocol. B) Performance of Control (Con) and CSDS mice in social interaction test (SIT), forced swimming test (FST), sucrose preference test (SPT), and open field test (OFT). Unpaired t test. nCon = 12, nCSDS = 24. C) Representative heat map of trajectories of Con and CSDS mice during SIT test. D) Representative images of GFAP immunostaining (red) in the hippocampus of Con or CSDS mice. Scale bars = 200 µm. E) The immunostaining quantitative analysis of GFAP and number of cells positively labeled for GFAP. Unpaired t test. n = 6. F) GFAP fluorescence staining images (left) and 3D morphological reconstruction (right) of astrocytes in the Con and CSDS group. Scale bar = 10 µm. G) Quantitative analyses of the average surface area, the average number of processes, the total branch length, and the total volume of astrocytes. Unpaired t test. n = 12. H) Sholl analysis of hippocampal astrocytes in the Con and CSDS group. Two‐way ANOVA. n = 12. I) Schematic diagram of isolating ACSA‐2 positive astrocytes from the hippocampus of control and CSDS mice and followed by RNA‐seq. J) Enrichment plot of GSEA of apoptosis in hippocampal astrocytes of Con and CSDS mice (left), and heat map showing enriched differential expression genes (DEGs) in apoptotic gene set of Con and CSDS group (right). K) Representative TEM images of apoptotic bodies in the hippocampal astrocytes of Con and CSDS mice. Scale bars (overview) = 1 µm and Scale bars (magnified) = 0.2 µm. L) Analysis of the number of apoptotic bodies in the hippocampal astrocytes of Con and CSDS mice. M) Representative images of TUNEL (green), GFAP (astrocytes, red) and a merged image in the hippocampus of Con and CSDS mice, respectively. The percentage of TUNEL+, GFAP+ double labeled cells in the total GFAP+ cells were calculated in a 300 × 300 µm bin in the hippocampal DG (right). Scale bars (overview) = 40 µm and scale bars (magnified) = 20 µm. Unpaired t test. n = 6. All data are shown as mean ± S.E. M, * p < 0.05, ** p < 0.01, *** p < 0.001.
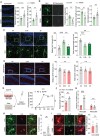 Figure 2
 CSDS results in higher levels of microglial IL‐6. A) Representative images (left) of Iba1 immunostaining in hippocampal microglia of mice in the Con group and CSDS group. The histogram (right) showed the relative fluorescence intensity of Iba1(Unpaired t test, n = 8) and the number of Iba1+ microglia (Unpaired t test, n = 6). Scale bar = 100 µm. B) Iba1 fluorescence staining images (left) and 3D morphological reconstruction (middle) in hippocampal microglia of Con and CSDS group. The histogram (right) showed the imaris‐based semi‐automatic quantification of cell morphometry, including total branch number, total process length and normalized soma size of Iba1+ microglia. Scale bar = 10 µm. Unpaired t test. n = 8. C) Representative images of Iba1 immunostaining in hippocampal microglia at 0 h, 0.5 h, and 2 h after once social defeat stress (left). Overview (top) and magnified (below) are shown. The histogram (right) showed the relative fluorescence intensity and total process length of Iba1+ microglia. Scale bars, 50 µm (overview) and 10 µm (magnified). One‐way ANOVA. n = 6. D) Representative images of GFAP immunostaining in hippocampal astrocytes at 0 h, 0.5 h, and 2 h after once social defeat stress. Overview (top) and magnified (below) are shown. The histogram (right) showed the relative fluorescence intensity and total branch number of GFAP+ astrocytes. Scale bars, 200 µm (overview) and 50 µm (magnified). One‐way ANOVA. n = 6. E) Drawing of ELISA technique for the detection of inflammatory cytokines secreted by BzATP‐activated cultured microglia (left). The concentration of IL‐6 released by microglia after BzATP treatment for 0 h, 4 h, 12 h, 24 h, and 36 h (right). Two‐way ANOVA. n = 4. F) The concentration of IL‐6 in hippocampus of Con and CSDS group. Unpaired t test. n = 6. G) The Il‐6 mRNA level in hippocampal microglia and hippocampal astrocytes of Con and CSDS group. Unpaired t test. n = 6. H) Representative images of Iba1 (microglia, green), IL‐6 (red) and a merged image in the hippocampus of Con and CSDS mice, respectively (left). The histogram (right) showed the colocalization coefficient of Iba1 and IL‐6. Scale bar = 10 µm. Unpaired t test. n = 8. I) Representative images of S100β (astrocytes, red), IL‐6 (green) and a merged image in the hippocampus of Con and CSDS mice, respectively (left). The histogram (right) showed the colocalization coefficient of S100β and IL‐6. Scale bar = 10 µm. Unpaired t test. n = 6. All data are shown as mean ± S.E. M, * p < 0.05, ** p < 0.01, *** p < 0.001.
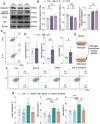 Figure 3
 IL‐6 released from activated microglia induces the apoptosis of astrocytes in vitro. A) Representative western blot images of Bax, Bcl‐2 and cleaved Caspase‐3 in astrocytes treated with PBS, IL‐6 and LPS. B) Western blot analysis of Bax (n = 7), Bcl‐2 (n = 7) and cleaved Caspase‐3 (n = 4) expression of astrocytes treated with PBS, IL‐6 and LPS. One‐way ANOVA. C) Representative images of FACS analysis of apoptosis in astrocytes treated with PBS (Con) or IL‐6. D) Apoptosis rate of astrocytes treated with PBS (Con) or IL‐6. Unpaired t test. n = 5. E) Drawing of primary cultured astrocytes stimulated with BzATP‐treated microglia conditioned medium (MCM). F) Representative images of FACS analysis of astrocytes treated with PBS (Control), BzATP, MCM alone or MCM combined with IL‐6 antibody. G) Apoptosis rate of astrocytes treated with Con, BzATP, MCM alone or MCM combined with IL‐6 antibody. One‐way ANOVA. n = 6. All data are shown as mean ± S.E.M, * p < 0.05, ** p < 0.01, *** p < 0.001.
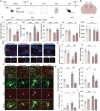 Figure 4
 Minocycline alleviates anxiety and depression‐like behaviors and decreases astrocytes atrophy. A) Experimental timeline of Minocycline (Mino) treatment, CSDS protocol and behavioral tests. B) Drawing of the cannula implanted sites. C) Performance of Con and CSDS mice treated with Mino or aCSF in SIT, FST, SPT, and OFT. Two‐way ANOVA. n = 9. D) Representative images of GFAP (red) staining in the hippocampus of Con and CSDS mice treated with Mino or aCSF via an infusion cannula. Scale bars (overview) = 40 µm and scale bars (magnified) = 10 µm. E) Quantitative immunostaining and total branch numbers analysis of GFAP+ cells in Con and CSDS mice treated with Mino or aCSF via an infusion cannula. Two‐way ANOVA. n = 8. F) Representative images of Iba1 (green) and IL‐6 (red) staining in the hippocampus of Con and CSDS mice treated with Mino or aCSF via an infusion cannula. Scale bars (overview) = 40 µm and scale bars (magnified) = 10 µm. G) Quantitative immunostaining and normalized soma size analysis of Iba1+ cells in Con and CSDS mice treated with Mino or aCSF via an infusion cannula. Two‐way ANOVA. n = 6. H) The histogram showed the colocalization coefficient of Iba1 and IL‐6 in Con and CSDS mice treated with Mino or aCSF. Two‐way ANOVA. n = 5. I) The concentration of IL‐6 in hippocampus in Con and CSDS mice treated with Mino or aCSF. Two‐way ANOVA. n = 4. All data are shown as mean ± S.E.M, * p < 0.05, ** p < 0.01, *** p < 0.001.
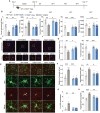 Figure 5
 P2X7R deletion alleviates anxiety and depression‐like behaviors and decreases astrocytes atrophy. A) Experimental timeline of WT and P2X7R−/− mice treated with CSDS protocol and behavioral tests. B) Performance of WT and P2X7R−/‐ mice treated with Con or CSDS in SIT, FST, SPT, and OFT. Two‐way ANOVA. n = 5. C) Representative images of GFAP (red) staining in the hippocampus of WT and P2X7R−/− mice treated with Con or CSDS. Scale bars (overview) = 40 µm and scale bars (magnified) = 10 µm. D) Quantitative immunostaining and total branch numbers analysis of GFAP+ cells in WT and P2X7R−/− mice treated with Con or CSDS. Two‐way ANOVA. n = 5. E) Representative images of Iba1 (green) and IL‐6 (red) staining in the hippocampus of WT and P2X7R−/− mice treated with Con or CSDS. Scale bars (overview) = 40 µm and scale bars (magnified) = 10 µm. F) Quantitative immunostaining and normalized soma size analysis of Iba1+ cells in WT and P2X7R−/− mice treated with Con or CSDS. Two‐way ANOVA. n = 5. G) The histogram showed the colocalization coefficient of Iba1 and IL‐6 in WT and P2X7R−/− mice treated with Con or CSDS. Two‐way ANOVA. n = 5. H) The concentration of IL‐6 in hippocampus in WT and P2X7R−/− mice treated with Con or CSDS. Two‐way ANOVA. n = 4. All data are shown as mean ± S.E.M, * p < 0.05, ** p < 0.01, *** p < 0.001.
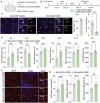 Figure 6
 Knockdown of microglial IL‐6 alleviates CSDS‐induced depressive‐like phenotype as well as hippocampal astrocytes atrophy. A) Schematic diagram showing the experimental strategy for IL‐6 knockdown of hippocampal microglia in vivo. B) Timeline of experimental strategy for IL‐6R knockdown of hippocampal astrocytes in vivo. C) Representative images of the AAV‐infected microglia (EGFP), Iba1 (cy5), IL‐6 (red) in hippocampus. Scale bars (magnified, left) = 10 µm and scale bars (overview, right) = 40 µm. D) The proportion of EGFP+ cells in the number of Iba1+ microglia is shown left. n = 8. And the histogram (right) showed the colocalization coefficient of Iba1 and IL‐6. Unpaired t test. n = 4. E) Performance of Cx3cr1‐CreERT2 mice treated with AAV‐DIO‐EGFP and AAV‐DIO‐shil6 after CSDS in SIT, FST, SPT, and OFT. Unpaired t test. n = 6. F) Representative images of GFAP (red) staining in the hippocampus of CSDS mice treated with AAV‐DIO‐EGFP and AAV‐DIO‐Shil6r. Scale bars (overview) = 40 µm and scale bars (magnified) = 10 µm. G) Imaris‐based semi‐automatic quantification of total branch numbers (n = 7), relative GFAP intensity (n = 6) and total branch length analysis (n = 8) of GFAP+ astrocytes. Unpaired t test. All data are shown as mean ± S.E.M, * p < 0.05, ** p < 0.01, *** p < 0.001.
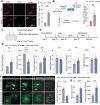 Figure 7
 Knockdown of astrocytes IL‐6 receptor (IL‐6R) alleviates CSDS‐induced depressive‐like phenotype as well as hippocampal astrocytes atrophy. A) Representative images of GFAP (red) and IL‐6R (green) staining in the hippocampus of Con and CSDS mice. The proportion of IL‐6R+ / GFAP+ cells in the number of GFAP+ cells is shown (right). Scale bars = 25 µm. Unpaired t test. n = 6. B) Schematic diagram of isolating ACSA‐2 positive astrocytes from the hippocampus of Con and CSDS mice followed by RT‐PCR (left). Hippocampal astrocyte expression level of Il‐6r mRNA in Con and CSDS group (right). Unpaired t test. n = 6. C) Schematic diagram showing the experimental strategy for IL‐6R knockdown of hippocampal astrocytes in vivo. D) Timeline of experimental strategy for IL‐6R knockdown of hippocampal astrocytes in vivo. E) Performance of Aldh1l1‐CreERT2 mice treated with AAV‐DIO‐EGFP and AAV‐DIO‐shIL‐6R of after CSDS in SIT, FST, SPT, and OFT. Unpaired t test. n = 5. F) Representative images of the AAV‐infected astrocytes in mouse hippocampus (left). Scale bars (magnified, left) = 10 µm and scale bars (overview, right) = 40 µm. The proportion of IL‐6R+ / EGFP+ cells in the number of EGFP+ astrocytes is shown right. Unpaired t test. n = 5. G) Imaris‐based semi‐automatic quantification of total branch numbers and total branch length analysis of EGFP+ astrocytes. Unpaired t test. n = 5. All data are shown as mean ± S.E.M, * p < 0.05, ** p < 0.01, *** p < 0.001.
Similar articles
Astrocytes-induced neuronal inhibition contributes to depressive-like behaviors during chronic stress.
Hao T, Du X, Yang S, Zhang Y, Liang F. Hao T, et al. Life Sci. 2020 Oct 1;258:118099. doi: 10.1016/j.lfs.2020.118099. Epub 2020 Jul 17. Life Sci. 2020. PMID: 32682917
Targeting microglial GLP1R in epilepsy: A novel approach to modulate neuroinflammation and neuronal apoptosis.
Zhang K, Yang Z, Yang Z, Du L, Zhou Y, Fu S, Wang X, Liu D, He X. Zhang K, et al. Eur J Pharmacol. 2024 Oct 15;981:176903. doi: 10.1016/j.ejphar.2024.176903. Epub 2024 Aug 16. Eur J Pharmacol. 2024. PMID: 39154823
Activation of P2X7 receptor and NLRP3 inflammasome assembly in hippocampal glial cells mediates chronic stress-induced depressive-like behaviors.
Yue N, Huang H, Zhu X, Han Q, Wang Y, Li B, Liu Q, Wu G, Zhang Y, Yu J. Yue N, et al. J Neuroinflammation. 2017 May 10;14(1):102. doi: 10.1186/s12974-017-0865-y. J Neuroinflammation. 2017. PMID: 28486969 Free PMC article.
[Mechanism of Microglial Surveillance and Protection against Alexander Disease Pathology].
Saito K, Koizumi S. Saito K, et al. Brain Nerve. 2025 Mar;77(3):281-288. doi: 10.11477/mf.188160960770030281. Brain Nerve. 2025. PMID: 40064494 Review. Japanese.
Neuroinflammation and stress-induced pathophysiology in major depressive disorder: mechanisms and therapeutic implications.
Zhao K, Zhang Y, Yang S, Xiang L, Wu S, Dong J, Li H, Yu H, Hu W. Zhao K, et al. Front Cell Neurosci. 2025 Apr 23;19:1538026. doi: 10.3389/fncel.2025.1538026. eCollection 2025. Front Cell Neurosci. 2025. PMID: 40336842 Free PMC article. Review.
Cited by
Salivary Biomarkers as a Predictive Factor in Anxiety, Depression, and Stress.
Budala DG, Luchian I, Virvescu DI, Tudorici T, Constantin V, Surlari Z, Butnaru O, Bosinceanu DN, Bida C, Hancianu M. Budala DG, et al. Curr Issues Mol Biol. 2025 Jun 26;47(7):488. doi: 10.3390/cimb47070488. Curr Issues Mol Biol. 2025. PMID: 40728957 Free PMC article. Review.
Mechanisms of the effect of gut microbes on depression through the microbiota-gut-brain axis.
Zhou X, Wang S, Wang X, Chen X, Zhou P, Ma K, Zhang P. Zhou X, et al. Front Nutr. 2025 Aug 6;12:1634548. doi: 10.3389/fnut.2025.1634548. eCollection 2025. Front Nutr. 2025. PMID: 40843192 Free PMC article. Review.
Association between the Alpha-1-acid glycoprotein concentrations and depression in US adult women: a cross-sectional study from NHANES 2021-2023.
Zhao W, Zhang H, Li Z, Ma C, Huo X, Guo N. Zhao W, et al. Front Psychiatry. 2025 Jun 3;16:1555321. doi: 10.3389/fpsyt.2025.1555321. eCollection 2025. Front Psychiatry. 2025. PMID: 40530060 Free PMC article.
References
Anderson K. M., Collins M. A., Kong R., Fang K., Li J., He T., Chekroud A. M., Yeo B. T. T., Holmes A. J., Proc. Natl. Acad. Sci. U. S. A. 2020, 117, 25138. - PMC - PubMed Nagy C., Suderman M., Yang J., Szyf M., Mechawar N., Ernst C., Turecki G., Mol. Psychiatry 2015, 20, 320. - PMC - PubMed Czeh B., Nagy S. A., Front. Mol. Neurosci. 2018, 11, 56. - PMC - PubMed Torres‐Platas S. G., Nagy C., Wakid M., Turecki G., Mechawar N., Mol. Psychiatry 2016, 21, 509. - PubMed Cao X., Li L. P., Wang Q., Wu Q., Hu H. H., Zhang M., Fang Y. Y., Zhang J., Li S. J., Xiong W. C., Yan H. C., Gao Y. B., Liu J. H., Li X. W., Sun L. R., Zeng Y. N., Zhu X. H., Gao T. M., Nat. Med. 2013, 19, 773. - PubMedMeSH terms
Actions
Actions
Actions
Actions
Actions
Actions
Actions
Actions
Actions
Actions
Actions
Actions
Actions
Actions
Actions
Substances
Actions
Grants and funding
82174499/National Natural Science Foundation of China 82130032/National Natural Science Foundation of China 31930042/National Natural Science Foundation of China ZYYCXTD-C-202008/Innovation Team and Talents Cultivation Program of National Administration of Traditional Chinese Medicine 2018SHZDZX01/Shanghai Municipal Science and Technology Major Project Innovative Research Team of High-level Local University in Shanghai 21DZ2271800/Shanghai Key Laboratory of Acupuncture Mechanism and Acupoint Function ZJ LabLinkOut - more resources
Full Text Sources
PubMed CentralMedical
MedlinePlus Health Information网址:Microglia https://klqsh.com/news/view/207408
相关内容
Microglia随便看看
最新乐趣
- 好享福呀,们太子殿下终于收到了深爱之人的绳结
- 柳智敏 低腰牛仔裤look
- 此男就这样天天跟老婆撒娇
- 谢嘉鱼接萧无衣回家,家人永远是你后盾
- 刘小玲对振民失望 微博VC计划
- 无奖竞猜这是哪个水的笑声
- 展博你怎么回事,谁让你出口成章的
- 阿尔卡拉斯世界杯观赛视频,看一次笑一次
- 百花拾光机③ | 巩俐
- 太有女王气场了,感觉像飘过来一样
热点乐趣
- 87279
- 66133
- 63249
- 55622
- 36657
- 31206
- 30517
- 22249
- 19346
- 17878